How confident are you in making predictions based on data?
If you’re relying on gut feelings alone, it’s time to shift gears.
Python regression analysis empowers you to unearth hidden insights and enhance your predictive accuracy.
From the simplicity of linear regression to the complexities of logistic and polynomial models, mastering these techniques can transform your decision-making process across various domains.
Dive into the world of regression analysis with Python to unlock the tools you need for better predictions and data-driven success.
Python Regression Analysis: An Overview
Analiza regresji w Pythonie odgrywa kluczową rolę w eksploracji danych oraz modelowaniu predykcyjnym. Dzięki potężnym bibliotekom, takim jak scikit-learn i statsmodels, użytkownicy mogą łatwo implementować różne modele regresji, co sprawia, że jest to niezbędne narzędzie dla analityków danych.
Popularnymi typami modeli regresji są:
-
Regresja liniowa: Umożliwia modelowanie relacji między zmiennymi niezależnymi a jedną zmienną zależną. Używana jest w sytuacjach, gdy istnieje liniowy związek pomiędzy zmiennymi.
-
Regresja logistyczna: Stosowana do modelowania sytuacji, w których wynik należy do jednej z dwóch klas, co czyni ją idealną do zadań klasyfikacyjnych.
Inne formy regresji, takie jak regresja wielomianowa, pozwalają na modelowanie bardziej złożonych nieliniowych relacji.
Wykorzystanie analizy regresji w Pythonie znajduje zastosowanie w wielu dziedzinach, w tym:
- Finanse: przewidywanie cen akcji.
- Medycyna: ocena ryzyka dla pacjentów na podstawie różnych czynników.
- Marketing: analiza skuteczności kampanii reklamowych.
Python jako język programowania znacząco ułatwia te procesy dzięki prostemu składni i szerokiemu ekosystemowi pakietów analitycznych. Użytkownicy mogą łatwo przygotować dane, dostosować modele regresji oraz ocenić wyniki, co prowadzi do lepszych decyzji biznesowych.
W erze zdominowanej przez dane, zrozumienie analizy regresji w Pythonie jest nieodzownym elementem strategii opartej na danych.
Understanding Linear Regression in Python
Linear regression is a widely used statistical method for modeling the relationship between a dependent variable and one or more independent variables. It can be formulated as:
𝑦 = 𝛽₀ + 𝛽₁𝑥₁ + … + 𝜖
where 𝑦 represents the predicted value, 𝛽₀ is the y-intercept, 𝛽₁ is the regression coefficient for the independent variable 𝑥₁, and 𝜖 is the error term.
The primary goal of linear regression is to find the optimal coefficients (𝛽₀, 𝛽₁, …) that minimize the difference between the observed values and the predicted values. This is typically achieved using the least squares method, which minimizes the sum of the squared residuals, defined by the objective function:
J(𝛽₀, 𝛽₁) = (1/2n) ∑(𝑦ᵢ – (𝛽₀ + 𝛽₁𝑥ᵢ))²
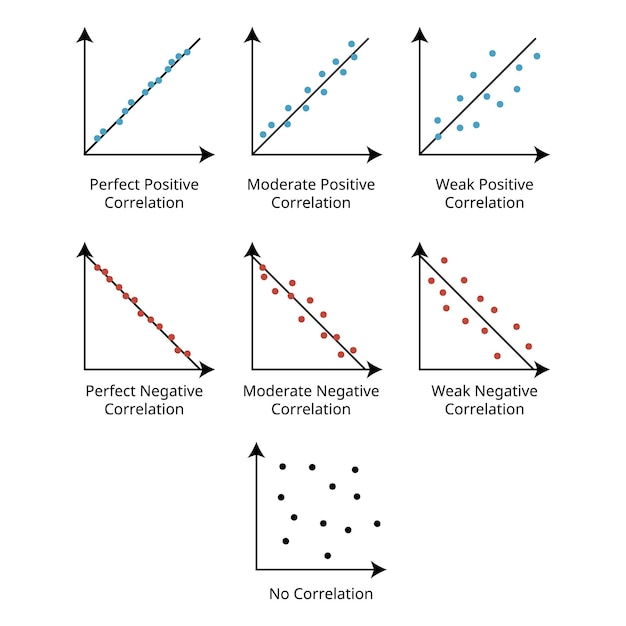
Estimating regression coefficients allows us to understand how changes in independent variables influence the dependent variable. A positive regression coefficient indicates a direct relationship, while a negative coefficient implies an inverse relationship.
To ensure the reliability of predictions made using linear regression, model evaluation metrics are essential. Two commonly used metrics are:
-
R-squared (𝑅²): This value ranges from 0 to 1, indicating the proportion of variance in the dependent variable explained by the independent variables. A higher 𝑅² value signifies a better fit.
-
Mean Squared Error (MSE): This metric measures the average of the squares of errors, providing insight into the prediction accuracy of the model. Lower MSE values correspond to better model performance.
By understanding these principles and evaluation techniques, users can effectively apply linear regression in Python, benefiting from its potential for accurate forecasting and data analysis.
Logistic Regression and Its Applications
Logistic regression is a statistical method used to predict binary outcomes—typically a yes/no or true/false scenario. It employs the logistic function to model the probability that a dependent variable belongs to a particular category. The formula used is
[
P(Y=1|X) = \frac{1}{1 + e^{-(\beta0 + \beta1X1 + \ldots + \betanX_n)}}
]
where ( P ) is the probability, ( \beta ) represents the coefficients, and ( X ) denotes the independent variables.
The logistic regression model expresses outcomes in terms of odds ratios, providing insights into how changes in independent variables affect the likelihood of the dependent variable’s outcomes. The odds ratio quantifies the odds of an event occurring relative to it not occurring.
Practical Applications of Logistic Regression
Logistic regression finds utility across various sectors, such as:
-
Healthcare: Used for diagnosing diseases by predicting the presence or absence of a condition based on patient data.
-
Finance: Assists in credit scoring by predicting the likelihood of a borrower defaulting on loans.
-
Marketing: Analyzes customer behavior, aiding in targeted advertising based on purchase likelihood.
Statistical significance in regression analysis is particularly critical in determining whether the results of a logistic regression are reliable. By assessing p-values for the coefficients, analysts can discern which variables significantly contribute to predicting the outcome.
Overall, the unique ability to analyze categorical data and provide binary predictions distinguishes logistic regression from linear regression, which is primarily suited for continuous outcomes.
Exploring Polynomial Regression in Python
Polynomial regression extends linear regression by fitting a polynomial curve to the dataset, allowing for a more flexible representation of relationships between variables.
This technique is particularly useful when observing non-linear patterns that linear regression cannot adequately capture. Selecting polynomial regression over linear regression may be warranted when visual analysis indicates a curvilinear relationship.
However, choosing the right degree for the polynomial is crucial. A low degree may lead to underfitting, failing to capture complexities in the data, while a high degree can result in overfitting, where the model learns noise instead of the underlying distribution.
To navigate the bias-variance trade-off, consider using cross-validation techniques to evaluate model performance across different polynomial degrees.
Testing various degrees provides insight into how well the regression algorithm generalizes:
- Degree 1: Represents a linear relationship.
- Degree 2: Captures simple curves.
- Higher degrees (3+): Accommodate more intricate relationships, though risk overfitting.
The choice of degree influences model performance metrics such as R² and RMSE, which should be investigated to ensure appropriate curve fitting.
By understanding these aspects of polynomial regression, practitioners can effectively leverage this powerful tool for more accurate predictions in Python.
Implementing Regression Analysis with Python Libraries
Najpopularniejszymi bibliotekami do analizy regresji w Pythonie są scikit-learn i statsmodels.
scikit-learn library
scikit-learn jest wszechstronną biblioteką, która oferuje uproszczony proces implementacji regresji.
Aby przeprowadzić regresję liniową, wykonaj następujące kroki:
- Importuj potrzebne pakiety:
   from sklearn.model_selection import train_test_split
   from sklearn.linear_model import LinearRegression
   from sklearn import metrics
- Podziel dane na zestawy treningowe i testowe:
X_train, X_test, y_train, y_test = train_test_split(X, y, test_size=0.2, random_state=42)
- Utwórz i dopasuj model:
   model = LinearRegression()
   model.fit(X_train, y_train)
- Dokonaj predykcji:
y_pred = model.predict(X_test)
- Oceń model:
print('Mean Absolute Error:', metrics.mean_absolute_error(y_test, y_pred))
statsmodels library
statsmodels jest bardziej zaawansowaną biblioteką, oferującą szczegółowe statystyki dla modeli regresji.
Aby przeprowadzić regresję wielokrotną za pomocą statsmodels:
- Importuj bibliotekę:
import statsmodels.api as sm
- Dodaj stałą do danych:
X = sm.add_constant(X)
- Utwórz model i dopasuj go:
model = sm.OLS(y, X).fit()
- Wyświetl wyniki:
print(model.summary())
Automatyczne modelowanie regresji
Automatyczne modelowanie regresji w Pythonie może być realizowane różnymi technikami, w tym przy użyciu biblioteki scikit-learn w połączeniu z metodami wyboru cech. Wprowadza to większą efektywność w procesie analizy.
Dzięki tym krokom i przykładom, można łatwo implementować regresję w Pythonie, zarówno na poziomie podstawowym, jak i bardziej zaawansowanym, co pozwala na efektywne modelowanie danych.
Evaluating and Interpreting Regression Results
Ocena wyników regresji jest kluczowa dla wartości modeli predykcyjnych.
Najczęściej stosowanymi metrykami oceny modeli regresyjnych są:
-
R² (Współczynnik determinacji) – określa, w jakim stopniu zmienność zmiennej zależnej jest wyjaśniana przez zmienne niezależne. Wartość 1 oznacza doskonałe dopasowanie.
-
RMSE (Pierwiastek średni kwadratowy błędu) – mierzy, jak dobrze model przewiduje rzeczywiste wyniki. Im niższa wartość, tym lepsze dopasowanie.
-
MSE (Średni błąd kwadratowy) – jest podobny do RMSE, ale nie bierze pierwiastka, co może sprawić, że jest mniej intuicyjny.
Analiza reszt jest istotnym narzędziem umożliwiającym ocenę jakości modelu. Wykresy reszt powinny być losowo rozłożone wokół osi zerowej, co wskazuje na dobrą zgodność modelu z danymi.
Wykonanie analizy wariancji (ANOVA) pozwala zrozumieć, czy wpływ zmiennych niezależnych jest istotny statystycznie. Wartości p z ANOVA powinny być poniżej wybranego poziomu istotności, zazwyczaj 0.05.
Interpretacja współczynników jest również kluczowa. Wartości te pokazują, jak zmiana w zmiennej niezależnej wpływa na zmienną zależną. Umożliwia to identyfikację kluczowych zmiennych wpływających na wyniki.
Na koniec, zidentyfikowanie wartości odstających jest kluczowe w analizie regresji. Mogą one znacząco wpłynąć na wyniki modelu i muszą zostać albo zaadresowane, albo usunięte, aby poprawić jego dokładność.
Common Challenges in Regression Analysis
Podczas analizy regresji, można napotkać różne wyzwania, które mogą wpłynąć na jakość wyników. Dwa główne z nich to overfitting i underfitting.
Overfitting w regresji występuje, gdy model jest zbytnio dopasowany do danych treningowych. Taki model ma wysoką dokładność na danych szkoleniowych, ale nie radzi sobie dobrze z danymi testowymi. Aby uniknąć tego problemu, warto korzystać z technik takich jak walidacja krzyżowa, regularyzacja oraz ograniczenie liczby cech.
Z kolei underfitting występuje, gdy model jest zbyt prosty, aby uchwycić zależności w danych. W takim przypadku model nie będzie w stanie dokładnie przewidywać wartości. Aby temu zapobiec, kluczowe jest użycie modelu o odpowiedniej złożoności, który odpowiednio uchwyci cechy danych.
Ważnym aspektem wydajnej analizy regresji jest także selekcja cech. Nieprawidłowy wybór cech może prowadzić do nieoptymalnych wyników i błędnych wniosków. Techniki takie jak selekcja cech lub analiza głównych składowych (PCA) mogą pomóc w identyfikacji najistotniejszych zmiennych.
Kolejnym problemem, jaki można napotkać, jest multikolinearność, gdzie dwie lub więcej unikalnych zmiennych niezależnych są ze sobą skorelowane. To może prowadzić do niestabilnych i trudnych w interpretacji współczynników regresji. Aby zminimalizować ten problem, można wyeliminować skorelowane zmienne lub zastosować techniki zmniejszające wymiarowość, takie jak PCA.
Właściwe rozpoznanie i zarządzanie tymi wyzwaniami jest kluczowe dla uzyskania wiarygodnych i dokładnych wyników analizy regresji.
Python regression analysis empowers data scientists by providing powerful tools for exploring relationships between variables.
From understanding linear regression basics to implementing more complex models, this article covered essential techniques.
Real-world applications showcase the versatility of regression in predicting outcomes and informing decision-making across various industries.
The insights gained from using Python for regression can lead to substantial improvements in business strategies and academic research.
Embracing these methods not only enhances analytical skills but also contributes to positive, data-driven outcomes.
Harnessing Python regression analysis opens doors to a brighter future in data science.
FAQ
Q: What is regression?
A: Regression is a statistical method used to model the relationship between a dependent variable and one or more independent variables, predicting outcomes based on established patterns.
Q: When do you need regression?
A: Regression is needed for tasks such as forecasting future values, understanding relationships between variables, and driving predictions for data-driven decision-making.
Q: What are the types of linear regression?
A: There are three main types:
- Simple linear regression (one independent variable)
- Multiple linear regression (multiple independent variables)
- Polynomial regression (non-linear relationships)
Q: How do you implement simple linear regression in Python?
A: Implementing simple linear regression in Python involves importing libraries, preparing data, fitting the model using scikit-learn, and evaluating the results to make predictions.
Q: What is multiple linear regression?
A: Multiple linear regression models the relationship between a dependent variable and multiple independent variables, using the formula ( y = \beta0 + \beta1x1 + \beta2x2 + … + \betapx_p ).
Q: How does polynomial regression differ from simple linear regression?
A: Polynomial regression extends simple linear regression by including non-linear terms, allowing for complex relationships between variables, in contrast to the straight-line approach of simple linear regression.
Q: Why might you experience underfitting or overfitting in regression models?
A: Underfitting occurs when a model is too simplistic to capture the underlying data patterns, while overfitting happens when a model learns noise, resulting in poor performance on new data.
Q: What are some key Python packages for performing regression analysis?
A: Key packages include:
- NumPy for efficient array handling
- scikit-learn for machine learning applications
- statsmodels for detailed statistical modeling
Q: How can regression performance be evaluated?
A: Regression performance can be evaluated using the coefficient of determination (R²), which measures the proportion of variance explained by the model, with higher values indicating better fit.
Q: When is linear regression inappropriate for prediction?
A: Linear regression is inappropriate when data shows no significant relationship, evidenced by a low correlation coefficient (r), suggesting that predictions may not be valid.